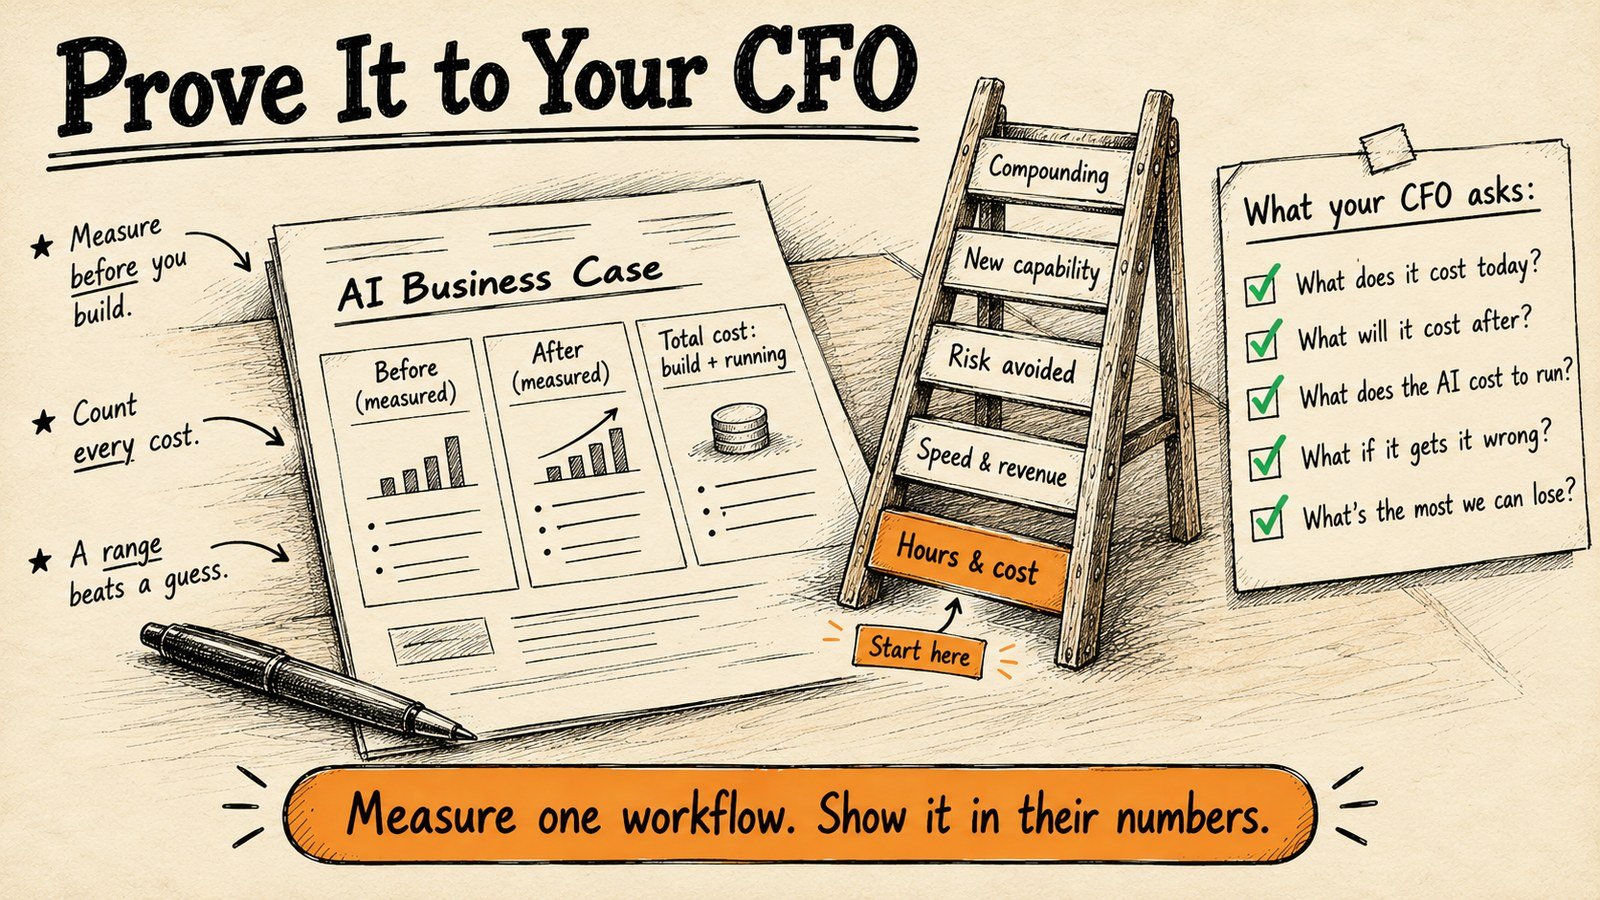
To prove AI ROI to your CFO, show three numbers in money the finance side already tracks: what one process costs today, what it costs after the change, and what the AI itself costs to build and run. Measure one workflow before and after, over weeks rather than days, and present a range you can defend rather than a headline you cannot.
Most AI business cases fail in the partners’ meeting for a simple reason: they argue about potential when the room wants evidence. Gartner predicted in June 2025 that over 40% of agentic AI projects will be cancelled by the end of 2027, and two of the three reasons it gave were escalating costs and unclear business value. A CFO who has read that headline will not approve a project on enthusiasm.
This guide gives you the questions to expect, a calculator for the number that matters most, a one-page summary you can take into the meeting, and an honest view of where ROI is genuinely hard to prove.
What will your CFO and partners actually ask?
Expect five questions, and expect them in money, not in model accuracy. If your case answers all five on one page, the conversation moves from “should we” to “which workflow first”.
- What does this process cost us today? Hours, people, error rework, in currency.
- What will it cost after? The same measures, for the same process, after the change.
- What does the AI itself cost? The build fee plus what it costs to run every month: model usage, software licences, the time someone spends checking its work.
- What happens when it gets something wrong? Who checks the output, what is logged, and what can be reversed.
- What if it does not work? The most you can lose, and the point at which you would know.
Notice what is not on the list: how clever the model is. A finance partner reads cost per piece of work and hours released, so that is the language the case has to be written in.
What is the manual work costing you today?
Start with the cost of the work as it is, because every other number in the case depends on it. Pick up to three tasks your team repeats every week. Enter how long each takes, how often it happens and how many people do it, then your loaded hourly cost (salary plus overheads) in your own currency.
The calculation is minutes × times a week × people × working weeks, divided by 60, then × your hourly cost. Nothing you type leaves this page unless you ask for the summary below.
Get a one-page summary with your numbers, the five questions answered, what a first pilot would prove and the terms, ready to print or save as a PDF.
We send it to Shishir so he can answer any questions you have. No newsletter, no sequence.
For a sense of scale, as an illustration only: four people each spending three hours a week on the same re-keying is 12 hours a week, around 550 hours a year. At your own charge-out rate, that is the number to hold against the cost of fixing it.
How do you set a baseline your CFO will trust?
Write down five numbers before anything changes, with the date you measured them. Without a recorded “before”, any “after” is a claim, and a finance partner will treat it as one.
- Time per task, measured over at least a couple of weeks, not estimated from memory.
- Volume: how many times the task happens a week or a month.
- People involved and their loaded hourly cost.
- Error or rework rate, and what one error costs to put right.
- Turnaround: how long the client or colleague waits for the result.
Here is what a measured before and after looks like. For Numerology Matrix, each personalised client reading took 3–4 hours of expert work. After the generative-AI system went live it takes 8 minutes, a 95% reduction in time per reading. That was a four-month platform build, not a 21-day pilot, so it is not evidence of a timeline; it is evidence of the format. Both numbers were measured, which is why they hold up.
If you did not measure the process before the change, you cannot prove the change improved it. Measure first, even if the project is months away.
Which kinds of value should you count, and when?
Count the hard savings first and present the rest separately, with their assumptions shown. AI value tends to arrive in layers: time and cost first, then speed and revenue effects, then risk and capability effects that take longer to show and are harder to attribute.
Layer 1: Direct cost reduction
Hours released and errors avoided on the process you measured. This is the layer to lead with, because it is the one you can prove.
Layer 2: Revenue and speed
Faster turnaround for clients, more work handled by the same team, quicker decisions. Real, but it needs an attribution assumption, so show the assumption.
Layer 3: Risk avoidance
Errors and compliance problems that no longer happen. Measure it against your own historical incident rate, never against a hypothetical.
Layer 4: Capability
Work you could not take on before. Describe it plainly; do not force a number onto it.
Layer 5: Compounding
Improvements that grow as the system handles more cases. Show the trend month by month once you have one.
| Layer | What to measure | How to measure | When it usually shows |
|---|---|---|---|
| 1: Direct cost | Hours released, errors avoided | (Baseline − current) × volume × cost | First weeks |
| 2: Revenue and speed | Turnaround, work handled, conversion | Before/after with a stated attribution % | First months |
| 3: Risk avoidance | Incidents, compliance findings | (Historical rate − current rate) × cost per incident | Several months |
| 4: Capability | New work you can take on | Described, not forced into a number | Several months |
| 5: Compounding | Month-on-month improvement | Trend across layers 1–3 | A year or more |
The timing column is a planning guide from how these projects usually unfold, not a measured average.
What goes on the one-page summary?
One page, eight lines, written so someone with no AI knowledge can read it. The summary the calculator produces follows this structure, and it is worth keeping updated monthly once a system is live.
- The workflow and the date the baseline was measured
- Baseline: time, volume, people, error rate, cost
- Current: the same measures, latest month
- Difference in hours and in money, per month and cumulative
- Total cost of the AI: build fee plus monthly running cost
- Net position: the difference minus the total cost
- Risks and controls: who checks the output, what is logged
- Trend: improving, flat or getting worse
If your CFO needs a glossary to read the ROI page, the page is wrong.
What makes a CFO stop trusting the numbers?
Five habits lose the room, and each one is avoidable.
Measuring too early
A system that handles more cases each week gets better at the unusual ones. Judging it on its first days understates it; set the review date before you start.
Counting only some of the cost
Leaving out running costs, licences or the time someone spends checking the output makes the case look better and fall apart later. Put every cost in.
Ignoring what would have happened anyway
If volumes were rising, the fair comparison is against what the manual process would have cost at the new volume, not the old one.
Presenting technical metrics
Accuracy percentages are not business value. Translate everything into hours, money and turnaround.
One confident number
A single headline figure invites a single objection. A range with its assumptions written down invites a discussion about the assumptions, which is the discussion you want.
A board that trusts a modest number approves the next project. A board that doubts an optimistic number stops the first one.
What if the ROI is genuinely hard to prove?
Say so, and split the case into what you can prove, what you can estimate and what you can only describe. Forcing every benefit into a number is how a credible case becomes an incredible one.
- Prove: the direct cost and time numbers from your baseline.
- Estimate: revenue and risk effects, each with its assumption stated.
- Describe: capability and long-term effects, without a number.
Some projects should not go ahead at all. If no one owns the workflow, or the data lives only in inboxes, fix that first; here are the cases where you should not adopt AI yet.
Not sure your data is ready for any of this? The free AI readiness assessment shows the gaps before you build the case.
How do you get real numbers before committing?
Run one workflow as a small, time-boxed pilot and judge it on your own baseline. Gartner predicted in July 2024 that at least 30% of generative AI projects would be abandoned after proof of concept by the end of 2025, which is why the pilot has to end in a running system and a measured result, not a demo.
The KORIX 21-day pilot is built that way. Week 1 measures your baseline and agrees in writing what “live” means. It ends with an ROI and risk report for your partners. The published range is 15K–40K, half at kick-off and the second half only if the system is live on Day 21. If Week 1 shows your data is not workable, we stop on Day 7 and you keep the readiness report and plan.
Want your first real ROI numbers?
Bring the summary from the calculator to a free 30-minute fit check. You leave with the workflow to measure first, a price range and a straight yes or no.
Book a free 30-minute fit check →Measure one workflow.
Present it in their numbers.
Proving AI ROI to a CFO is a measurement job, not a persuasion job. Record the baseline, count every cost, lead with what you can prove and show your assumptions for the rest. A modest number your partners trust beats a big one they question.

AI cost and pricing: the full series
This article is part of our AI cost and pricing series. The pillar guide covers the whole topic; the others each go deeper on one part.
- Pillar guideHow much does AI implementation cost?Start here: real 2026 cost ranges, the factors behind every quote, and the costs vendors leave out.
- How much does an AI agent cost?The build, run and maintain breakdown for an AI agent, and how to budget it.
- AI pricing models comparedPer-seat, per-use and outcome pricing compared on real three-year cost.
- What drives software development pricingScope, complexity, integrations and risk: the factors behind every quote.
- Hidden costs of the wrong partnerRework, lock-in, lost time and no ownership, and how to spot them upfront.
How do I prove AI ROI to my CFO?
Show three numbers in money the finance side already tracks: what one process costs today, what it costs after the change, and what the AI costs to build and run. Measure the same workflow before and after, over weeks rather than days, and present a range with its assumptions written down.
How long does it take to see ROI from AI?
Direct time and cost savings on a single workflow can be measured within weeks of it going live, provided you recorded a baseline first. Revenue, risk and capability effects take months to show and are harder to attribute, so present them separately.
What does an AI system cost to run after launch?
Usually model usage and software licences, billed to your own accounts, plus the time someone spends checking the output. Put all of it in the business case; leaving running costs out makes the numbers look better and fall apart later.
Should I include soft benefits like faster decisions?
Yes, but separately from the hard savings and with the assumption behind each one stated. Lead with what you can prove; describe what you cannot measure rather than forcing a number onto it.
What if the AI gets something wrong?
Include the controls in the case: who checks the output, what is logged, and what can be reversed. The cost of putting errors right belongs in the before and after numbers too.
Can I measure AI ROI before committing to a full rollout?
Yes. Run one workflow as a time-boxed pilot and judge it on your own baseline. The KORIX 21-day pilot measures the baseline in Week 1, agrees in writing what live means, and ends with an ROI and risk report; the second half of the fee is owed only if it is live on Day 21.