
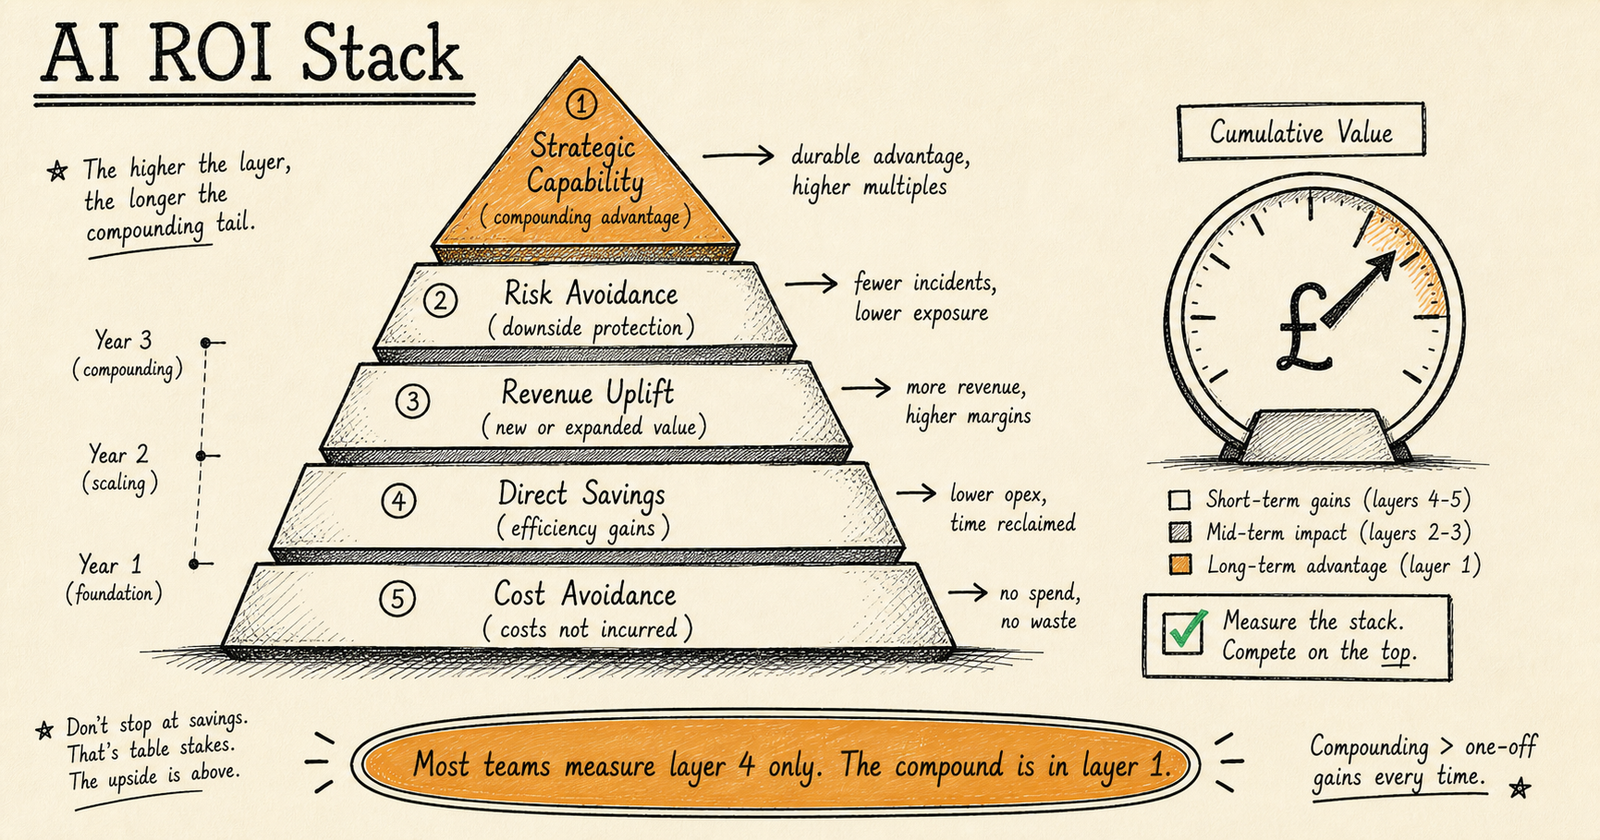
Measuring AI ROI requires a 5-layer framework: direct cost reduction (hours saved, errors reduced), revenue acceleration (faster decisions, better targeting), risk avoidance (compliance costs prevented), capability premium (things now possible that were not before), and compound effects (improvements that accelerate over time). Most teams fail at ROI measurement not because AI is not delivering value, but because they only measure the first layer and ignore the rest.
You deployed an AI system six months ago. The engineering team says it is working well. But when your CFO asks “what is the return on this investment?” the room goes quiet. Not because the system is failing — but because nobody set up the measurement to answer that question. This is the most common failure mode in enterprise AI, and it kills more programmes than bad models do.
The problem is that traditional ROI calculation — (gain from investment minus cost of investment) divided by cost of investment — does not map cleanly to AI. AI creates value across multiple dimensions simultaneously: it reduces costs, accelerates revenue, avoids risks, enables new capabilities, and compounds improvements over time. If you only measure direct cost savings, you are presenting perhaps 30% of the actual value to your board. The other 70% is real, but invisible because you are not measuring it.
This article gives you a practical framework for measuring all five layers of AI ROI, with concrete formulas, realistic timelines, and a board presentation structure that translates AI performance into the financial language your executive team already speaks.
Why most teams can’t prove AI ROI
ROI feels impossible because traditional metrics do not map cleanly to AI. When your finance team calculates ROI on a new warehouse, the formula is straightforward: increased throughput minus lease cost. When they try to calculate ROI on an AI document processing system, the value is spread across time savings, error reduction, compliance improvement, employee reallocation, and capabilities that did not previously exist. No single metric captures all of it.
Many teams fall back on the “AI is different” excuse. They argue that AI value is too diffuse, too long-term, or too qualitative to measure. This is wrong. AI is not different — it just needs different measurement. You would not measure the ROI of a sales team by counting the number of phone calls they make. You would measure the revenue they generate. The same principle applies to AI: measure outcomes, not activity.
Consider what happened with one operations-heavy client we worked with. They were manually processing several thousand documents monthly with multiple staff members and frequent data-entry errors. The process was expensive, slow, and error-prone — but nobody had ever quantified exactly how expensive, how slow, or how error-prone. After deploying AI extraction, processing time dropped significantly and accuracy improved measurably. The ROI calculation was straightforward: hours saved multiplied by hourly cost, plus error reduction multiplied by cost per error. But it was only straightforward because we had established the baseline before deployment. Without those pre-deployment numbers, the team would have been guessing.
The three structural reasons teams cannot prove AI ROI are consistent across organisations:
- No baseline measurement. They never documented the cost, speed, and error rate of the process before AI. Without a “before” number, the “after” number is meaningless.
- Single-dimension measurement. They measure only direct cost savings and miss the other four layers of value: revenue acceleration, risk avoidance, capability premium, and compound effects.
- Technical language in financial conversations. They present model accuracy and processing speed to a board that thinks in cost per transaction and revenue per employee. The value is real, but the translation is missing.
If you are not sure whether your organisation has the data foundations needed for clean ROI measurement, an AI readiness assessment can identify the gaps before you deploy.
If you did not measure the process before AI, you cannot prove AI improved it. Before any deployment, document: time per task, cost per unit, error rate, throughput, and headcount involved. These five numbers are the foundation of every ROI calculation that follows.
The KORIX AI ROI Framework: 5 layers
Most organisations measure only Layer 1 — direct cost reduction — and present that as the total AI ROI. This typically captures 20–40% of the actual value. The remaining value is real, measurable, and often larger than the direct savings. But it requires a structured approach to capture it.
The framework works in layers because AI value accumulates over time. Layer 1 is visible within weeks. Layer 5 may take twelve months or more to materialise. Boards that understand this layered timeline make better investment decisions because they are not judging a twelve-month programme by its three-month results.
Layer 1: Direct Cost Reduction
This is the most tangible layer and the one your CFO will scrutinise first. It includes three components: time saved (hours no longer spent on the task, multiplied by the hourly cost of the people who were doing it), headcount freed (staff who can be redeployed to higher-value work), and error reduction (the cost of mistakes that no longer happen).
Direct cost reduction is measurable within one to three months of deployment. It maps directly to operating costs, which makes it the easiest layer to present to a board. The formula is simple: (baseline cost per unit minus post-AI cost per unit) multiplied by volume.
Layer 2: Revenue Acceleration
AI does not just reduce costs — it accelerates revenue by enabling faster decisions, better targeting, and new commercial capabilities. A demand forecasting system that improves inventory accuracy also reduces stockouts, which means more sales. A lead scoring system that prioritises higher-converting prospects means more revenue per sales hour.
Revenue acceleration is harder to attribute cleanly than cost reduction, but it is often the larger number. The measurement approach is A/B comparison where possible: compare revenue from AI-assisted processes against a control group using the old process. Where A/B is not feasible, use before-and-after comparison with controls for seasonal and market factors.
Layer 3: Risk Avoidance
Risk avoidance measures the bad things that did not happen because AI was in place. Compliance violations prevented. Audit findings avoided. Security incidents caught before they escalated. Regulatory penalties not incurred. For organisations in regulated industries — financial services, healthcare, legal — risk avoidance is frequently the largest single layer of AI ROI.
The challenge with risk avoidance is that you are measuring a counterfactual: what would have happened without AI. The most credible approach is to use historical incident rates as the baseline. If your pre-AI compliance error rate was 3.2% and post-AI it dropped to 0.4%, the risk avoidance ROI is the expected cost of the prevented incidents. For governed AI systems with complete audit trails, this calculation becomes significantly more defensible.
Layer 4: Capability Premium
Capability premium captures the value of things you can now do that were previously impossible or impractical. An AI system that analyses customer sentiment across fifty thousand support tickets per month is not just doing what a human team did faster — it is doing something that was never feasible at that scale. The insight it generates has value that cannot be measured as cost reduction because no cost existed before.
Measuring capability premium requires asking: what decisions can we now make that we could not make before? What markets can we enter? What products can we offer? What response time can we achieve? The monetary value is the revenue or cost impact of those new capabilities.
Layer 5: Compound Effects
AI systems improve over time as they process more data. A document extraction model that is 92% accurate in month one may be 97% accurate in month six because it has learned from edge cases. A demand forecasting model gets more precise as it accumulates more historical patterns. This compounding effect means that the ROI measured in month three is not representative of the ROI in month twelve.
Compound effects are measured by tracking the same metrics over time and fitting a trend. If cost per transaction is dropping 8% month over month, that compounding rate is itself a valuable metric to present to the board. It demonstrates that the AI investment is not just delivering returns — it is delivering accelerating returns.
How to calculate each layer
Each layer has a specific calculation approach. The key is not precision — it is consistency. A conservative estimate that you track monthly is far more valuable than a precise estimate that you calculate once and never update. Boards trust trends more than snapshots.
Layer 1 formula: Direct Cost Reduction
Monthly savings = (baseline hours per task − current hours per task) × tasks per month × fully loaded hourly cost
Add to this: (baseline error rate − current error rate) × volume × average cost per error. The “fully loaded hourly cost” should include salary, benefits, overhead, and management time — not just the base hourly rate. Most organisations undercount this by 30–50% because they use base salary instead of total cost of employment.
Layer 2 formula: Revenue Acceleration
Revenue uplift = (AI-assisted conversion rate − baseline conversion rate) × opportunity volume × average deal value
Where A/B testing is not possible, use: (post-deployment revenue − projected baseline revenue, adjusted for market factors) × AI attribution percentage. The attribution percentage is a judgment call — be conservative. A 40–60% attribution to AI for improvements in AI-assisted workflows is a credible starting point.
Layer 3 formula: Risk Avoidance
Risk avoidance = (historical incident rate − current incident rate) × average cost per incident
Include in “cost per incident”: regulatory penalties, audit costs, remediation effort, customer compensation, and reputational damage where quantifiable. For industries where a single compliance failure can cost six or seven figures, this layer often justifies the entire AI implementation cost on its own.
Layer 4 approach: Capability Premium
Capability premium does not have a clean formula because it measures net-new value. The approach is to identify each new capability AI enables and estimate its commercial value: new revenue streams opened, market segments now addressable, response times now possible, analysis depths now feasible. Track these as a portfolio of capability-driven outcomes.
Layer 5 approach: Compound Effects
Track any Layer 1–4 metric monthly and calculate the month-over-month improvement rate. If cost per transaction is dropping 5–10% per month consistently, that compound rate is itself a powerful board metric. Project the compound trajectory forward to show the board what the 12-month and 24-month ROI looks like if the trend holds.
| Layer | What to Measure | How to Measure | Timeline |
|---|---|---|---|
| L1: Direct Cost Reduction | Hours saved, errors reduced, headcount freed | (Baseline − current) × volume × cost | 1–3 months |
| L2: Revenue Acceleration | Conversion lift, deal velocity, new revenue | A/B test or before/after with attribution % | 3–6 months |
| L3: Risk Avoidance | Incidents prevented, compliance maintained | (Historical rate − current rate) × cost per incident | 6–12 months |
| L4: Capability Premium | New capabilities, markets, response times | Portfolio of capability-driven revenue/savings | 6–12 months |
| L5: Compound Effects | Month-over-month improvement rate | Trend analysis across L1–L4 metrics | 12+ months |
The biggest ROI mistake is measuring too early. AI systems improve over time as they learn from more data. A system measured at month one will underperform the same system measured at month six. Set expectations with your board for a 3–6 month measurement window before drawing conclusions about long-term ROI.
Want ROI Measurement Built In From Day One?
Our 21-Day AI Pilot includes baseline measurement, instrumentation, and a board-ready ROI framework — not just a working system, but the proof it works.
Explore the AI Pilot →The board presentation framework
Your board does not want to understand AI. They want to understand what AI is doing to the numbers they already track. The most effective AI ROI presentations never mention model architecture, training data, or inference speed. They present before-and-after comparisons in the financial language the board already uses.
What boards actually want to see
In our experience across multiple client board presentations, executives consistently prioritise three things: how much is this saving us (Layer 1), how much more revenue is it generating (Layer 2), and what risks is it reducing (Layer 3). Layers 4 and 5 are strategic context that supports continued investment — they are important but secondary to the financial headline.
The structure that works is a one-page summary with four sections:
- Headline metric: Total ROI as a single number or ratio (e.g., “3.2x return on AI investment year-to-date”)
- Before/after comparison: Three to five key metrics showing the pre-AI baseline versus current performance
- Layer breakdown: How the total ROI splits across the five layers, showing which types of value are materialising
- Trajectory: Month-over-month trend showing whether ROI is accelerating, stable, or declining
Before/after metrics that work
An e-commerce company we worked with needed AI demand forecasting across hundreds of SKUs. Their data lived in three disconnected systems — sales history in one platform, supplier lead times in another, marketing calendar in a spreadsheet. After building a unified data structure and deploying AI, inventory accuracy improved measurably within three months. Stockouts dropped. Overstock write-offs fell. The board presentation wrote itself: cost per unit of inventory holding before versus after, with clear cost attribution to the AI system.
The before/after format works because it requires no AI knowledge to interpret. Your CFO does not need to understand what a demand forecasting model does. They need to see that inventory holding cost dropped from X to Y, and that the drop is attributed to the AI system deployed in a specific month. That is a financial conversation, not a technical one.
The 1-page AI ROI summary structure
For each AI use case in production, maintain a living one-page document with this structure:
- Use case name and deployment date
- Baseline metrics (pre-AI, documented with date)
- Current metrics (latest month)
- Delta (improvement in absolute numbers and percentage)
- Financial impact (delta translated into monetary value per month and cumulative)
- Total cost of ownership (monthly AI operating cost including infrastructure, monitoring, and staff time)
- Net ROI (financial impact minus total cost of ownership)
- Trend (is the ROI improving, stable, or declining month over month?)
This single page, updated monthly, gives the board everything they need to evaluate and justify AI investment. It takes perhaps two hours per month to maintain once the instrumentation is in place. If you are considering whether your organisation is ready for this kind of structured measurement, check the 7 signs you are ready for AI.
The best board presentation is the one that could be understood by someone with zero AI knowledge. If your CFO needs a glossary to read your ROI report, the report is wrong.
Common ROI measurement mistakes
These five mistakes are not theoretical — they are patterns we see repeatedly in organisations that struggle to justify continued AI investment. Each one is avoidable with the right measurement structure in place from the start.
Mistake 1: Measuring too early
AI systems improve over time. A document processing model that is 91% accurate in week two may be 96% accurate in month four because it has been retrained on edge cases your data surfaces. Measuring ROI in the first month and extrapolating to a year produces an underestimate that can kill a programme that would have delivered strong returns by month six. Set the board’s expectations for a 3–6 month measurement window before drawing conclusions.
Mistake 2: Counting only direct savings
If your ROI calculation includes only Layer 1 (direct cost reduction), you are presenting a fraction of the real value. A compliance AI system might save 2,000 per month in direct processing time (Layer 1). But it also prevents compliance incidents that historically cost 50,000 each (Layer 3) and enables the compliance team to take on new regulatory requirements they previously lacked capacity for (Layer 4). Presenting only the 2,000 makes the investment look marginal when it is actually transformative.
Mistake 3: Ignoring the counterfactual
The counterfactual is: what would have happened without AI? If your industry is experiencing a skills shortage and your manual process was already struggling before AI, the relevant comparison is not “AI cost versus current process cost” — it is “AI cost versus the cost of the process degrading further without AI.” Some AI investments prevent deterioration rather than improve on a stable baseline. That prevention value is real ROI, but you have to measure it explicitly.
Mistake 4: Using vanity metrics
Model accuracy is not business value. A model that is 98% accurate on a low-stakes task generates less business value than a model that is 90% accurate on a high-stakes task. The metric that matters is not how accurate the AI is — it is what the accuracy produces in financial terms. Always translate technical metrics into their financial consequences: “98% accuracy means 2% of transactions require manual review, costing approximately X per month.”
Mistake 5: Not attributing compound effects
When your AI system gets better every month, that compounding improvement is itself a form of value that most organisations never quantify. If processing cost is dropping 6% per month due to continuous learning, that trajectory is worth presenting to the board. It shows that the AI investment is not just delivering returns — it is delivering accelerating returns. A flat ROI justifies maintenance. An accelerating ROI justifies expansion.
When in doubt, be conservative with attribution. A board that sees a conservative ROI estimate they trust is more likely to approve expansion than a board that sees an optimistic estimate they question. Credibility compounds in the same way that AI accuracy does.
When AI ROI is genuinely hard to prove
Not every AI project has a clean ROI calculation. Some projects deliver value that is real but structurally difficult to quantify. Acknowledging this honestly — rather than forcing every project into a dubious ROI framework — is itself a sign of measurement maturity.
Exploratory AI projects
Research and exploration projects — testing whether AI can solve a problem you are not yet sure is solvable — have uncertain ROI by definition. The appropriate framework here is not ROI but expected value: the probability of success multiplied by the value of success, minus the cost of the exploration. If a three-month exploration costs 30,000 and has a 40% chance of unlocking a capability worth 500,000 annually, the expected value is positive even if four out of ten explorations fail.
Governance and compliance AI
Governance AI is a particular challenge because its primary value is preventing bad outcomes rather than creating good ones. A financial services firm we worked with automated document analysis for loan applications. The ROI was not just processing speed — it was regulatory compliance maintained at scale. Compliance officers could trace every AI recommendation back to the source data and the decision logic. That traceability meant auditors could review decisions faster, audit preparation time dropped from hundreds of hours to a fraction of that, and the risk of audit findings decreased measurably.
That is risk avoidance ROI: the cost of the audit you did not fail, the penalty you did not receive, the remediation you did not need. It is real value, but it requires comparing against a counterfactual — what would have gone wrong without the governed AI system in place.
The honest approach
For AI projects where ROI is genuinely difficult to quantify, the most credible approach is layered honesty:
- Layer 1 (direct savings): Present the hard numbers you can prove
- Layers 2–3 (revenue and risk): Present conservative estimates with clear assumptions stated
- Layers 4–5 (capability and compound): Present qualitative descriptions of the strategic value, without forcing a number
A board that sees honest layering — some numbers you are confident in, some estimates you are transparent about, and some qualitative value you describe without inflating — trusts the entire presentation more than a board that sees a single inflated number they cannot verify.
If you are evaluating whether AI is right for your specific situation, our 21-Day AI Pilot is designed specifically to generate real ROI data from your own processes before you commit to full deployment. The pilot gives you Layer 1 numbers you can take to your board with confidence.
Stop measuring one layer.
Start measuring all five.
AI ROI is not a single number — it is five layers of value that materialise at different speeds. Direct cost reduction is the starting point, not the whole picture. Revenue acceleration, risk avoidance, capability premium, and compound effects are where the majority of AI value lives. Measure all five, present them honestly, and your board will see AI as an investment, not an expense.
How long does it take to see ROI from AI?
Most organisations see initial measurable results within 3 to 6 months of production deployment. A well-scoped 21-day pilot can demonstrate validation ROI even sooner. Strategic ROI — competitive advantage and new capabilities — typically emerges at the 6 to 12 month mark. The key is setting realistic expectations for each phase.
What is the average ROI of AI implementation?
Industry estimates suggest 150 to 300 percent ROI over three years for well-executed implementations (Source: McKinsey, 2025). However, this varies enormously by use case. Process automation tends to deliver faster returns than exploratory projects. The most reliable estimate comes from running a pilot on your specific process and extrapolating from measured results.
How do you calculate AI ROI?
Calculate across five layers: direct cost reduction (hours saved × hourly cost + errors reduced × cost per error), revenue acceleration (conversion uplift × deal value), risk avoidance (incidents prevented × cost per incident), capability premium (value of new capabilities), and compound effects (month-over-month improvement trajectory). Sum all five for complete ROI.
Can you measure AI ROI before deployment?
Yes, via a pilot. A 21-day AI pilot gives you real performance data from your own processes. By establishing baseline metrics before the pilot and measuring against them during, you get a credible ROI projection based on actual results rather than vendor estimates. This is significantly more reliable than pre-deployment forecasting based on industry benchmarks alone.
What are the hidden costs of AI that affect ROI?
Hidden costs include: data preparation and cleaning (often 40–60% of project effort), integration with existing systems, staff training and change management, ongoing model monitoring and retraining, governance and compliance overhead, and the operational owner’s time for maintenance. A realistic ROI calculation subtracts total cost of ownership, not just the initial build cost. See our guide on AI implementation costs for a complete breakdown.